

- Lower energy prices and a lower VAT rate in Germany depressed (headline) inflation in the Eurozone in 2020 by approximately 1%.
- In 2021, Germany has increased the VAT rate again and energy prices have risen significantly.
- As a result of the strong economic recovery in China, container freight rates on the Shanghai-Rotterdam
route, for example, have quadrupled. - As soon as the current lockdown measures come to an end, there will be enormous catch-up in demand
resulting in (temporarily) higher prices. - As a result, inflation in both the US and the Eurozone will be significantly higher in 2021 compared to
2020. - As a result of rising inflation expectations, 10-year interest rates in the Eurozone and especially the US
rose significantly in February. - Overloaded with debt, our economies cannot bear high interest burdens as a new recession and debt
crisis then becomes inevitable. - Central Banks, however, will do everything to prevent a new recession and thus ensure that interest rates
do not rise too much. - In the past, both the BoJ (2016) and the FED (1942) have already fixated the yield curve.
- Low interest rates, the economic recovery and better-than-expected corporate earnings remain positive
for equities. - Value equities are one of the most undervalued segments of the equity markets.
- Commodities are benefiting from an economic recovery and are therefore an attractive investment in 2021.
“Long-Term Wealth Protection and Accumulation Through Value Investing” By Dr Steven de Klerck, co-founder and manager of Pure Value Capital Fund.
Buying sound companies at inexpensive or cheap valuations. That is the key strategy underlying the philosophy of value investing. At the other side of the investment spectrum investors find so-called growth stocks (stocks that are considered to outperform the market because of their growth potential). The rationale for value investing can be traced back to the founding father of value investing, i.e., Benjamin Graham.
In 1949 Benjamin Graham published the book The Intelligent Investor, according to legendary investor Warren Buffett “by far the best book on investing ever written.” One of the key insights of the seminal work is the distinction between investing and speculation. According to Graham, an investment operation is one which, upon thorough analysis, promises safety of principal and a satisfactory return. Operations not meeting these requirements are speculative. Graham states that the safety of principal can be safeguarded, and a satisfactory return can be realized through the purchase of quality securities at low valuations, i.e., through the adoption of the so-called margin-of-safety principle. After all, there are two main causes to permanent or long-term capital losses: a) the purchase of low-quality securities and/or b) the purchase of companies far above their tangible value.
These insights were advanced by Graham based on a decades-long experience with the financial markets. In 2020, 70 years after the first publication of his work, we subjected Graham’s insights to an empirical analysis in four regions (US, Europe, Japan and Asia Pacific) over the 1963-2018 period using historical data, resulting in the research paper The Origins of Value Investing Revisited. Expensive (and inexpensive) companies were defined as stocks with the highest (lowest) market-to-book ratios. These companies are known in the investment community as growth stocks (value stocks). Quality was assessed by a company’s solvency, liquidity and profitability. Based on these metrics we were able to build stock portfolios with distinguishing characteristics.
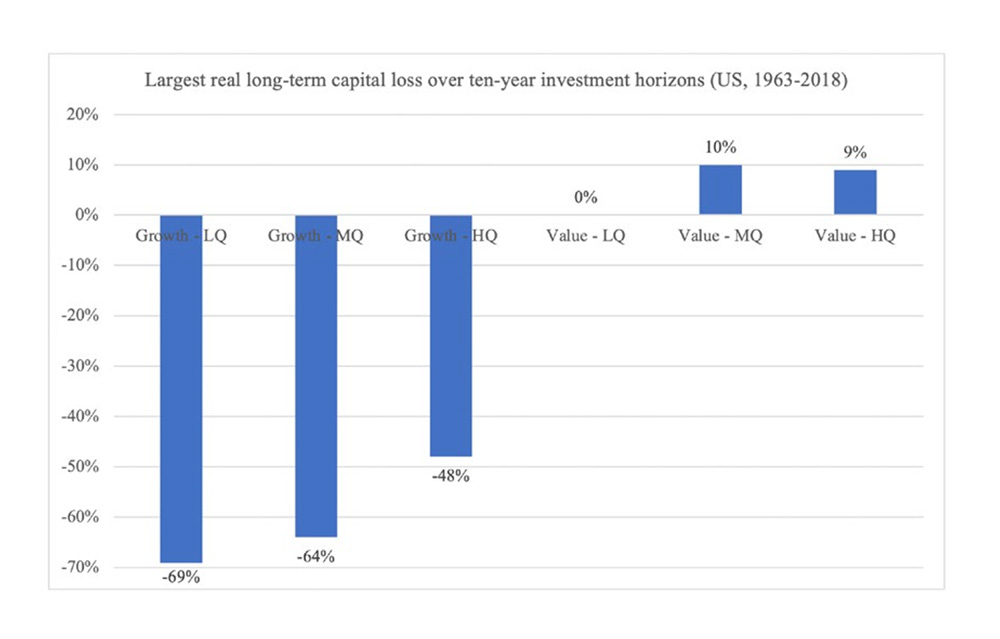
In a first step we subsequently looked at the worst real long-term capital losses over ten-year investment horizons for the various valuation- and quality-based portfolios. At Pure Value Capital we are convinced that most investors want to avoid a significant real capital loss on their invested capital over a ten-years investment horizon.
The results for the US over the 1963-2018 period, for example, are partly shown in Graph I. It is clear that the largest real long-term capital losses reside within the growth portfolios. These losses range between -48% for the Growth - High Quality (HQ) portfolio over the 2000-2010 period and -69% for the Growth - Low Quality (LQ) portfolio over the 1968-1978 period. For these growth portfolios the periods until full recovery of the initial capital in real terms run up to almost 23 years.
The US value portfolios on the other hand do not show a real long-term capital loss over their worst ten-year investment periods. The Value-High Quality (HQ) portfolio for example shows a small real capital gain of 9% over the 1965-1975 period. The periods until recovery of the US value portfolios are all close to ten years for these worst-case ten-year periods for value investors. Qualitatively similar results are documented in the other regions. We refer the reader to our paper for further details.
Graph I – Avoiding Real Long-Term Capital Losses Through Value Investing
Besides avoiding real long-term capital losses investors are of course also interested in realizing a healthy return on their invested capital. As a consequence, in a second step, after having mapped the investment risk of the valuation- and quality-based portfolios, we looked at the ten-year total real returns over the various decades in our dataset in the four regions (US, Europe, Japan and Asia Pacific). The results are shown in the table below. The first column ‘1964’ for example shows the total real return for the portfolios over the 1964-1974 decade. The last available decade in Table I runs from 2008 to 2018 in the column ‘2008’.
Table I – Consistently High Returns Through Value Investing

From Table I we observe that Growth - Low Quality (LQ) stocks realized a doubling of purchasing power in 4 out of the 14 available decades (29%). High valuation, high quality companies (Growth - HQ) show a total real return of +100% in 5 out of the 14 decades (36%). High quality value investors (Value - HQ) scored a doubling of purchasing power in 10 out of the 14 decades (71%). For the Value - Low Quality (LQ) portfolios this percentage is slightly lower.
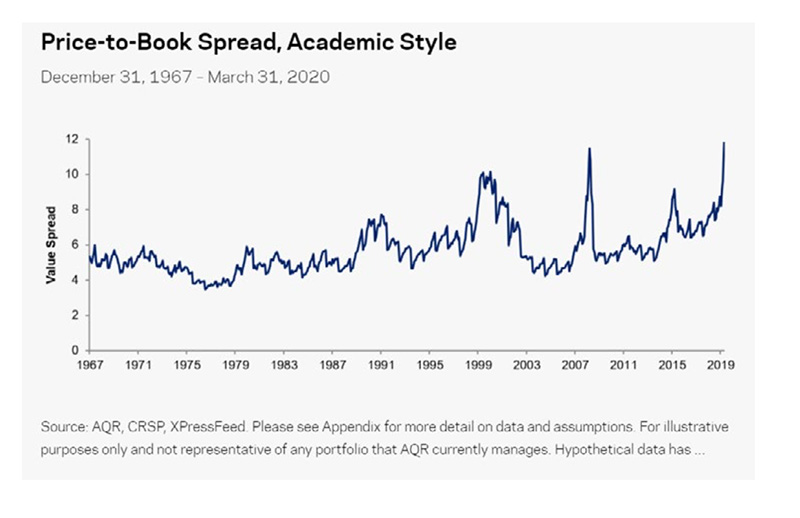
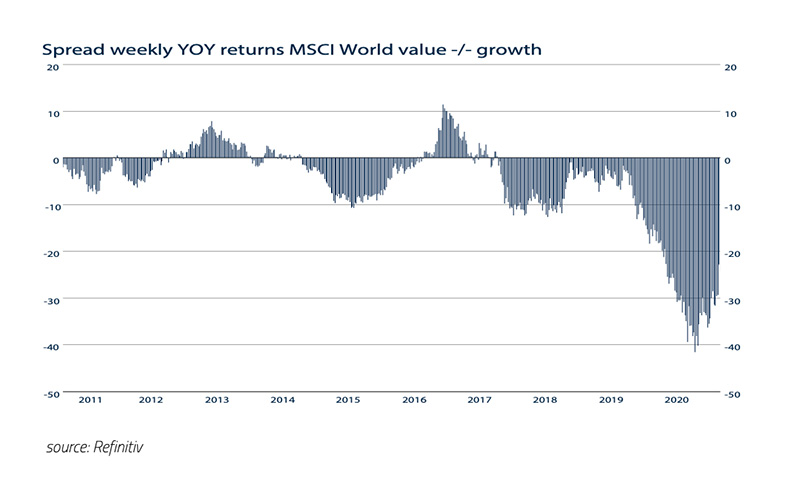
Astute followers of the financial markets know that over the past decade value stocks significantly lagged growth stocks. Never before has the valuation gap between the two types of companies been bigger (Graph II). This observation offers attractive opportunities for investors anno 2021. When the valuation gap between growth and value narrows over the next decade value investors with a focus on quality companies - at Pure Value Capital we coined the combination of both investment styles as fundamentally safe - look forward to potentially high future portfolio returns.
Graph II – Opportunities for Value Investors
When summarizing the empirical results of our research paper The Origins of Value Investing Revisited we concluded that high quality value investors (Value - HQ) have succeeded in combining low investment risk with high inflation-adjusted returns over the past decades across the four regions. High valuation, low quality investors (Growth - LQ) on the other hand have periodically been confronted with huge losses in purchasing power and overall subpar total real returns. Also, high quality growth investors (Growth - HQ) experienced their fair share of long-term capital losses across three out of the four regions (the exception is Europe) and globally. These findings are consistent with Benjamin Graham’s age-old insights from The Intelligent Investor.
Pure Value Capital is a Luxembourg-based fund managed by Dr. Steven De Klerck and Christophe De Wit. We strive for strong long-term investment returns and a maximum protection of our clients’ capital in real terms. We believe that both objectives are simultaneously realized by building fundamentally safe equity portfolios through a focus on inexpensive stocks with strong fundamentals.
The portfolio of the fund is invariably invested in the three major geographic areas (America, Europe and Asia), is diversified across industries and is spread over large cap, mid cap and small cap companies. The fund was launched in 2016 as a 0% subscription fee, 0% management fee and 0% redemption fee fund with a focus on fundamentally safe companies. The performance fee amounts to 20% above an annual hurdle rate of 4% with high-water mark. Quarterly subscription applies. Applications for subscriptions are reserved to well-informed investors.
For info: www.purevaluecapital.com

About the author:
Dr. Steven De Klerck (1980) holds a Master in Business Engineering (VUB) and an Advanced Master of Science in Statistics (KUL). He obtained a PhD in Applied Economic Sciences (UA) with regard to value investing and fundamental analysis. Over the 2014-2020 period he was Assistant Professor Corporate Finance at the KU Leuven.
In our newsletter edition from February 2021 we wrote that “higher oil prices are bad for the outlook for inflation and therefore for government bonds”. We ended the newsletter with “Although the structural outlook for inflation remains favorable for the time being, (headline) inflation will (temporarily) rise again in 2021. In 2020 (headline) inflation was only temporarily depressed by lower government taxes and sharply lower oil prices. “ This is clearly visible in the chart below in the composition of inflation in the Eurozone.
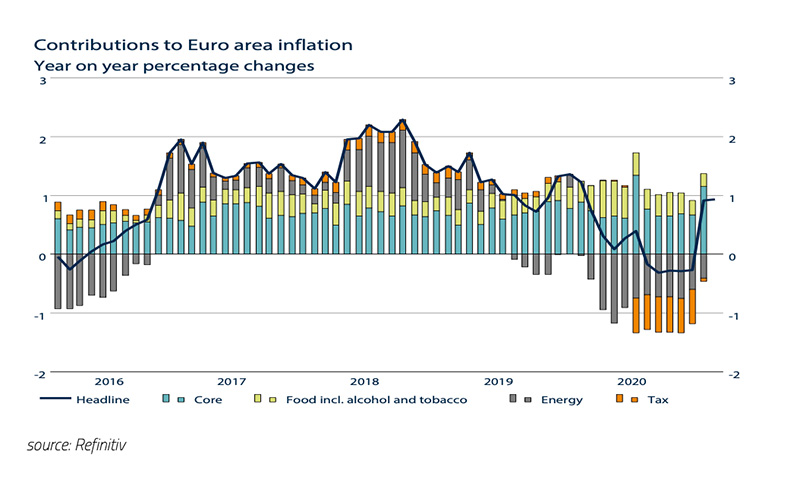
Lower energy prices and the lower VAT rate in Germany depressed (headline) inflation by approximately 1% in 2020. At the beginning of this year, the VAT reduction in Germany was reversed and energy prices will be significantly higher in 2021 compared to 2020. In addition, container freight rates have risen sharply, mainly as a result of the economic recovery in China. These have even quadrupled for the Shanghai-Rotterdam route. As soon as the current lockdown measures come to an end, there will be an enormous consumer catch-up in demand that will inevitably lead to (temporarily) higher prices. It is therefore inevitable that inflation will be considerably higher in 2021 than in 2020. The fact that the financial markets are now also concerned about this is clearly visible in the recently sharply increased inflation expectations in, for example, the US.
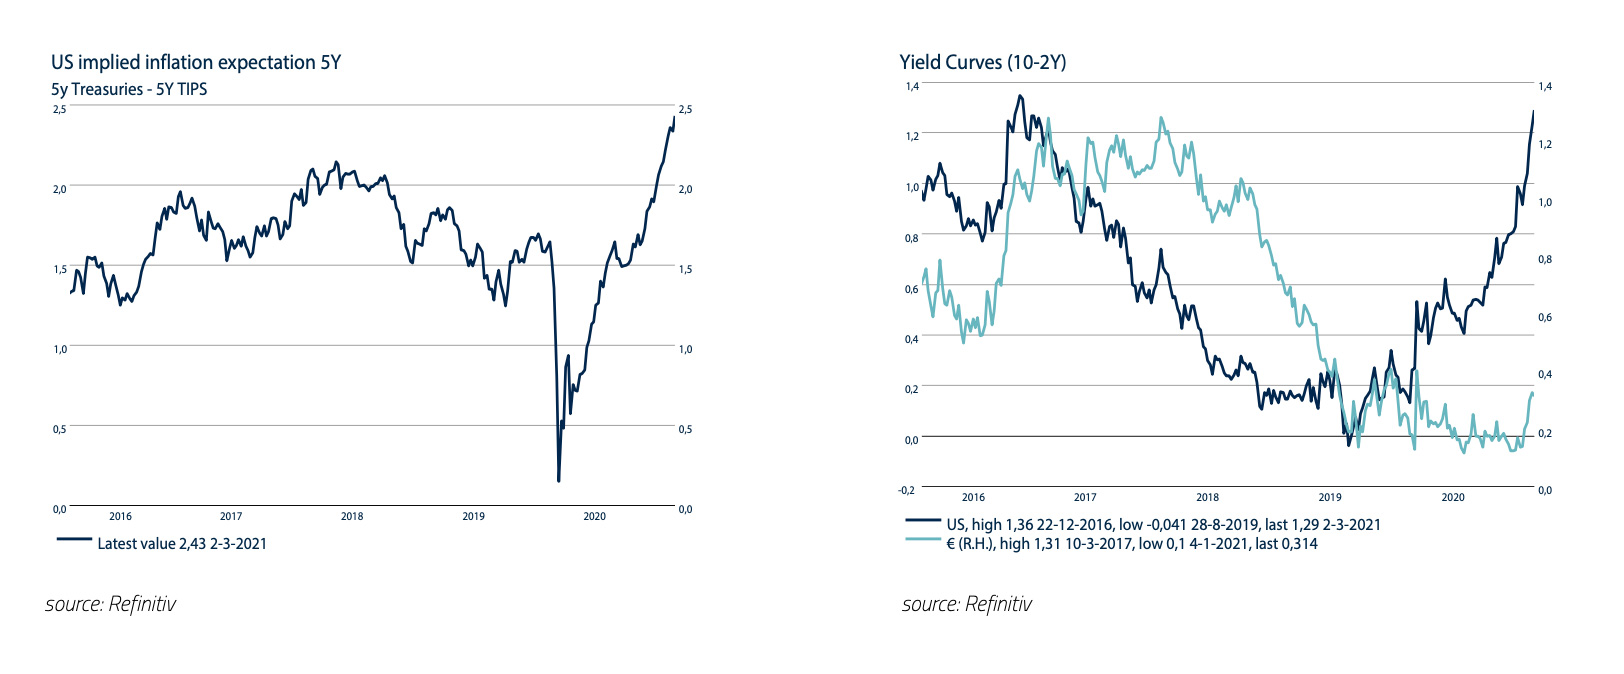
What is new, however, is that the bond markets suddenly started to worry about this in February as well. For example, the 10-year yield in the US rose in February to a level last seen in 2016/17. As a result, the yield curve (10-2 years) in the US steepened considerably. Although a steeper yield curve is good news for the interest margins of banks, it is bad news for the economy as it cannot bear a high interest burden due to the enormous amounts of accumulated debt. An excessive rise in interest rates will therefore inevitably lead to a new debt crisis and recession. However, we believe that it will not come to that. First, the aforementioned effects that lead to higher inflation in 2021 will (largely) disappear in 2022. In addition, the graphs below show that both unemployment and overcapacity in the business sector are still relatively high. As a result, wages will only rise moderate, and companies still have relatively little pricing power.
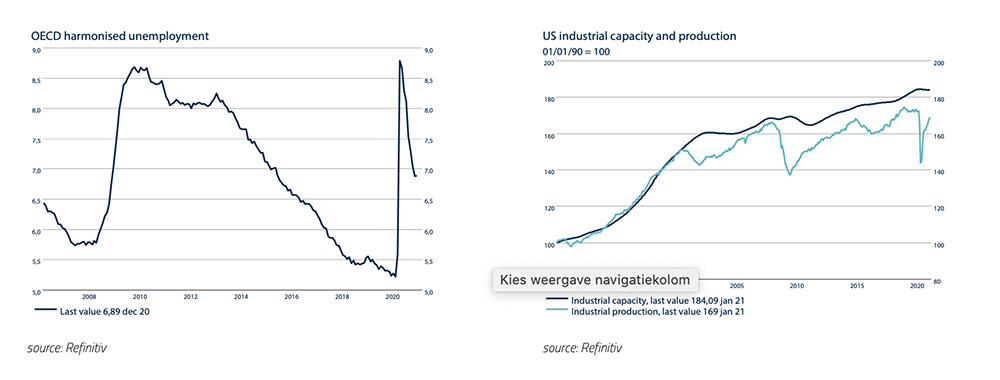
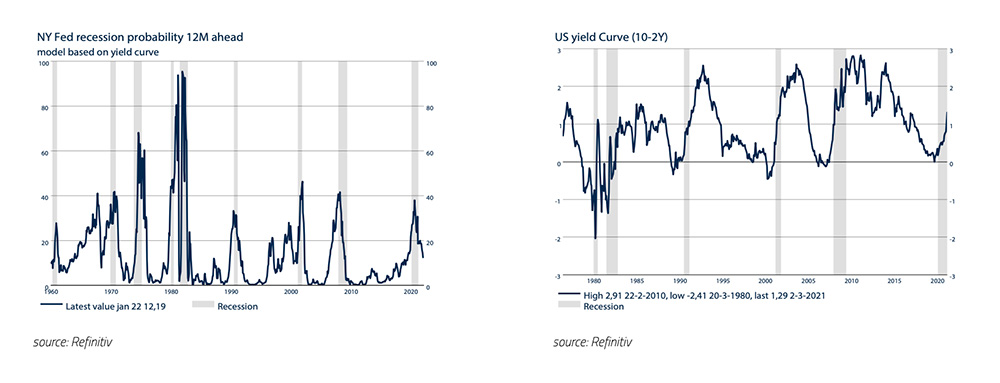
Labor productivity will also increase as a result of the accelerated application of ICT possibilities due to Covid-19, which will reduce production costs. We therefore do not expect that significantly higher inflation in 2021 will be followed by structurally significantly higher inflation in the coming years. Should interest rates nevertheless continue to rise in the financial markets in the near future, making a new recession and debt crisis likely, then in our view the Central Banks will not hesitate to intervene again in the bond markets in order to keep interest rates low. For example, a few years ago the Bank of Japan fixated the 10-year interest rate “around 0%” in order to keep the debts payable. The FED has done the same before. In the beginning of April 1942, the FED fixated the short-term interest rate at 0.375% and the long-term interest rate at 2.5% for many years in order to keep interest burdens low for the US government and US private sector. The FED even continued with this when inflation was temporarily at 10%. We therefore continue to believe that Central Banks in the world will continue to do everything they can to keep interest rates low and affordable. The chance of a new recession therefore remains low, and the risk is also gradually decreasing according to both the FED recession model and the bond markets.
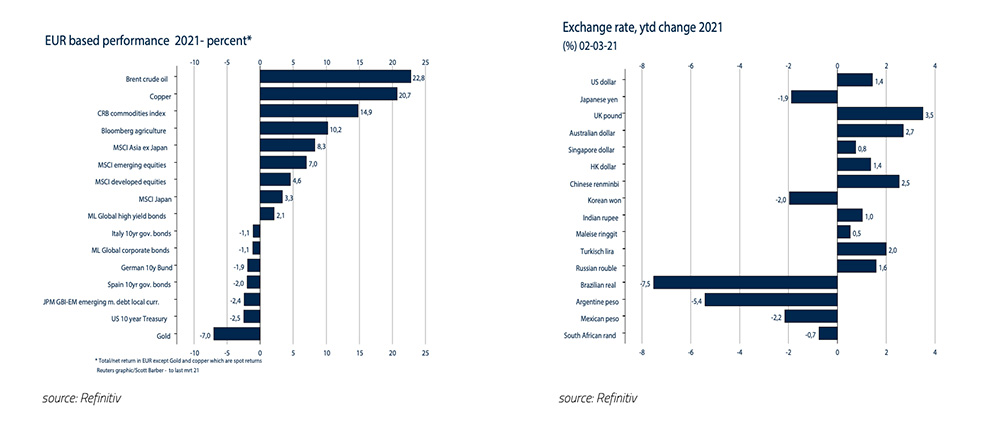
Stock markets initially reacted positively in February to the fact that more and more governments, thanks to the availability of successful vaccines, had started to vaccinate. In addition, the inauguration of President Biden and his $1,900 billion bailout package meant that equity investors increasingly dared to expect a relatively strong recovery in the economy and consequently corporate earnings in both 2021 and 2022. However, in the course of February, when bond markets started to discount the rising inflation of 2021, causing interest rates to rise quickly, a significant part of the price gains disappeared towards the end of the month. On balance, however, the MSCI World index still rose by +4.6% in Euro in the first two months of the year. This is partly because the US Dollar increased in value by +1.4% against the Euro. The fact that investors still expect a relatively strong economic recovery in 2021 and 2022 is also evident from the performance, in both January and February, of what are called the somewhat more “risky assets”. For example, the price of a barrel of Brent Crude Oil rose +22.8% and the CRB Commodity Index rose +14.9%. So-called “Safe Haven” assets, such as US Treasury bonds and gold, disappointed the most at -2.5% and -7.0% in Euro respectively.
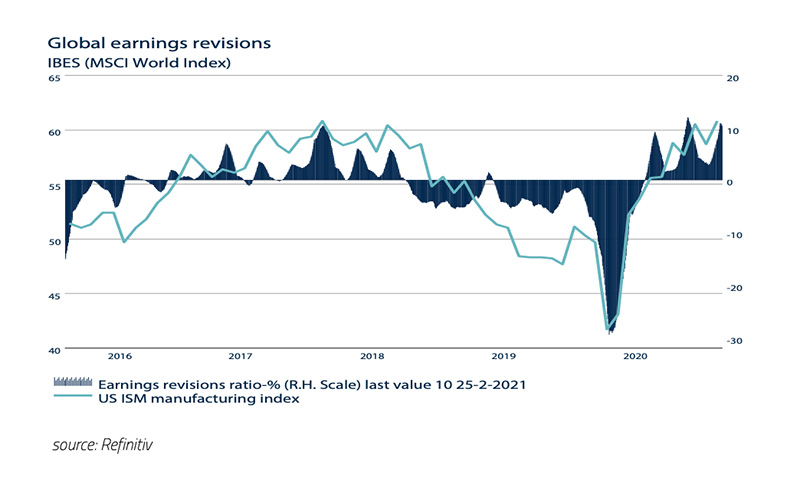
In our view, the outlook for equities remains favorable in 2021. We do expect inflation to rise structurally, but we also expect that the significantly higher inflation in 2021 will be mainly temporary. In addition, we are convinced that Central Banks will ensure that interest rates remain structurally low in order to facilitate continued economic recovery in 2021 and 2022. Furthermore, positive for equities are the better-than- expected corporate earnings, which means that analysts are constantly forced to revise their earnings expectations upwards.
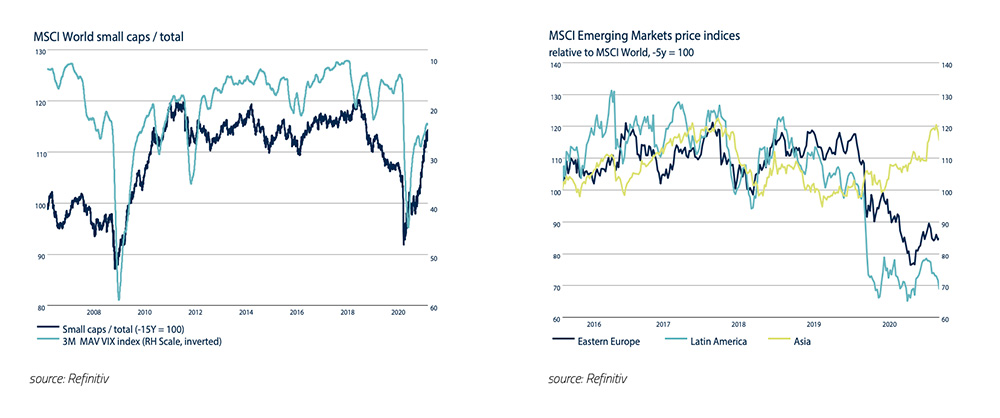
Small cap and Emerging Market Asia equities have recently recovered significantly from the underperformance against Large Cap Blue Chips equities.
Remarkably, this still does not apply to Value stocks which are now one of the most undervalued segments of the equity markets. Value investor Steven de Klerck elaborated in more detail on the considerations behind the addition of value stocks to an investment portfolio in this newsletter.
The strong performance of commodities (+14.9%) in general and Crude Oil (+22.8%) in particular so far this year is not entirely unexpected. The graph below clearly shows that commodities as a group are still relatively cheap and can (temporarily) be a good investment in an economic recovery. This was the case in 2004, 2009 and 2016. In view of the expected economic recovery in 2021 and 2022, commodities are, in our opinion, still an attractive investment.

Disclaimer Clause: While the information contained in the document has been formulated with all due care, it is provided by Trustmoore for information purposes only and does not constitute an offer, invitation or inducement to contract. The information herein does not constitute legal, tax, regulatory, accounting or other professional advice and therefore we would encourage you to seek appropriate professional advice before considering a transaction as described in this document. Any reference to third parties does not constitute an advertisement neither implies an affiliation with Trustmoore. Therefore, no liability is accepted whatsoever for any direct or consequential loss arising from the use of this document and from any reference to third party’s articles or opinions. The text of this disclaimer is not exhaustive, further details can be found here.


