
- Although economic growth in the second quarter was revised upwards in August, the US remained in a technical recession with growth of -1.6% in the first and -0.6% in the second quarter.
- The outlook for both the US and the global economy remains bleak as global household purchasing power is under severe pressure.
- Despite the poor economic outlook, fighting the current high inflation remains the number one priority for the FED (US Federal Reserve). The general expectation is that both the FED and the European Central Bank (ECB) will raise interest rates significantly in September.
- References are made to March 1980 when FED Governor Paul Volcker managed to curb 1970s inflation with a 20% FED fund rate and accepted a severe global recession.
- It is interesting to look at the FED policy in the 1950s. Even then inflation was more than 10%. The biggest difference was that the FED did not raise interest rates at all to fight inflation.
- There are, in our view, more similarities between the causes of current inflation and those of the 1950s than the 1970s.
- If true and expectations of a sharp decline in inflation materialize soon, the FED may have finished raising interest rates by the end of this year and the recession could remain relatively mild.
- Five years after all the bear markets since 1956, equities were on average 110% higher. So, it pays to be a long-term investor and not to panic.
- At 3.25%, the 10-year UST (United States Treasury) offers a positive real interest rate. See our explanation in the bond-section.
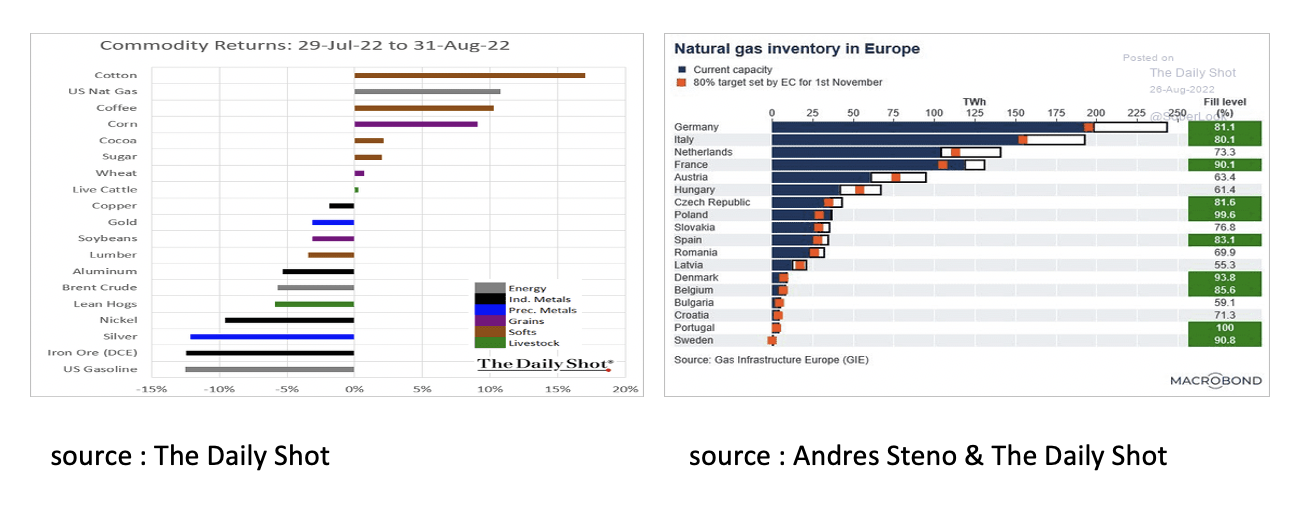
- Commodities as an asset class are not interesting anymore with a global recession unfolding and gas inventories in Europe almost up to scratch.
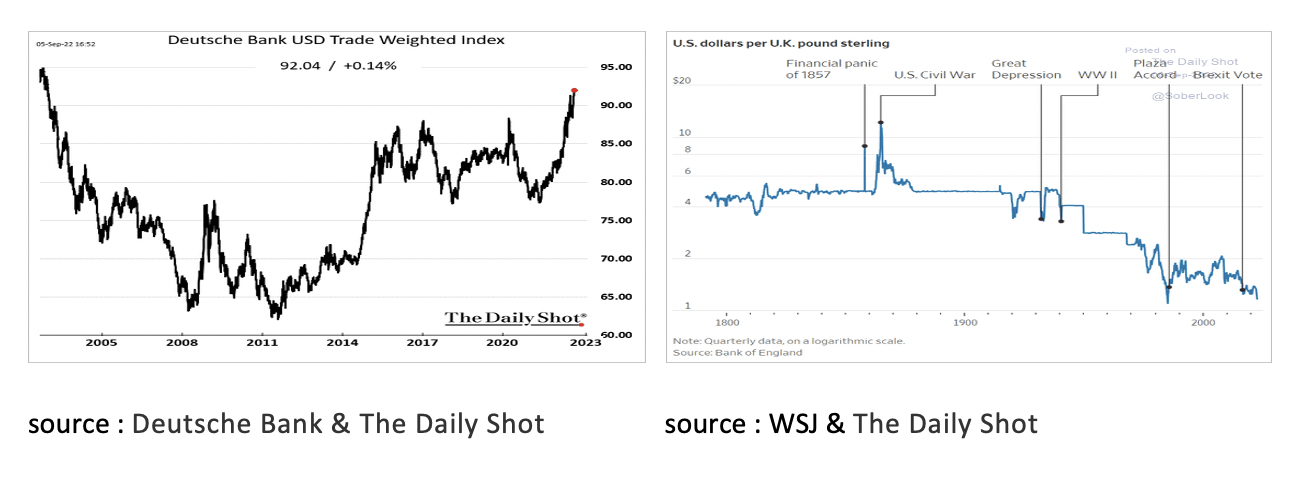
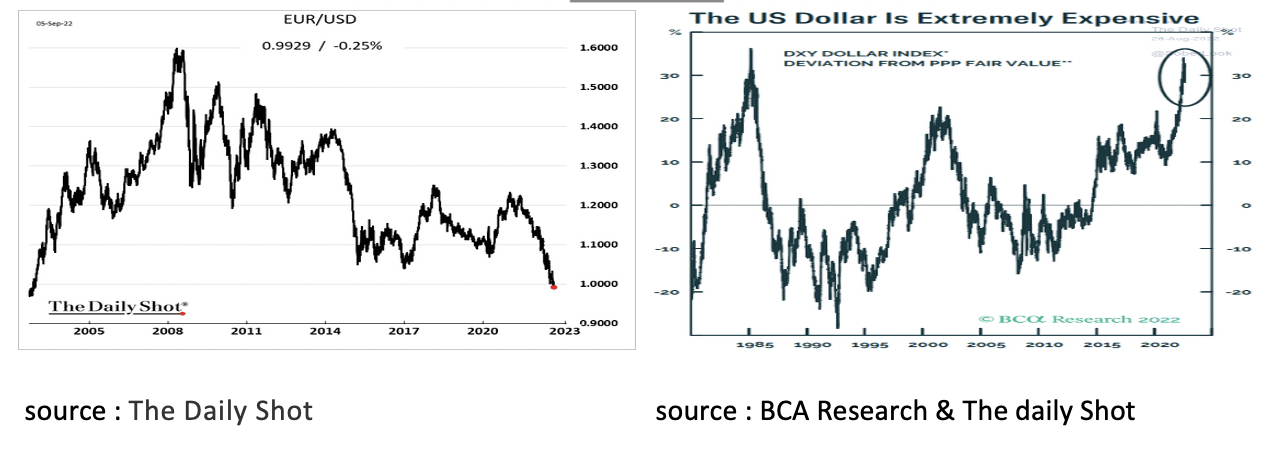
- The outlook for the US dollar remains positive for now. However, by measures such as the Purchasing Power Parity, the USD is currently one of the most overvalued currencies in the world.
Although economic growth in the second quarter was revised upwards in August, the US remained in a technical recession with growth of -1.6% in the first and -0.6% in the second quarter. Moreover, the outlook for both the US and the global economy remains bleak. As a result of high inflation and only limited wage increases, the purchasing power of households worldwide is under severe pressure. Since consumption, in most countries in the (Western) world, makes up 55% to 70% of the economy, this does not bode well for the economic outlook in the coming 12 months. All the more so because in his Jackson Hole speech, FED Governor Powel once again vigorously reiterated what was previously reported in the Federal Open Market Committee (FOMC) minutes.
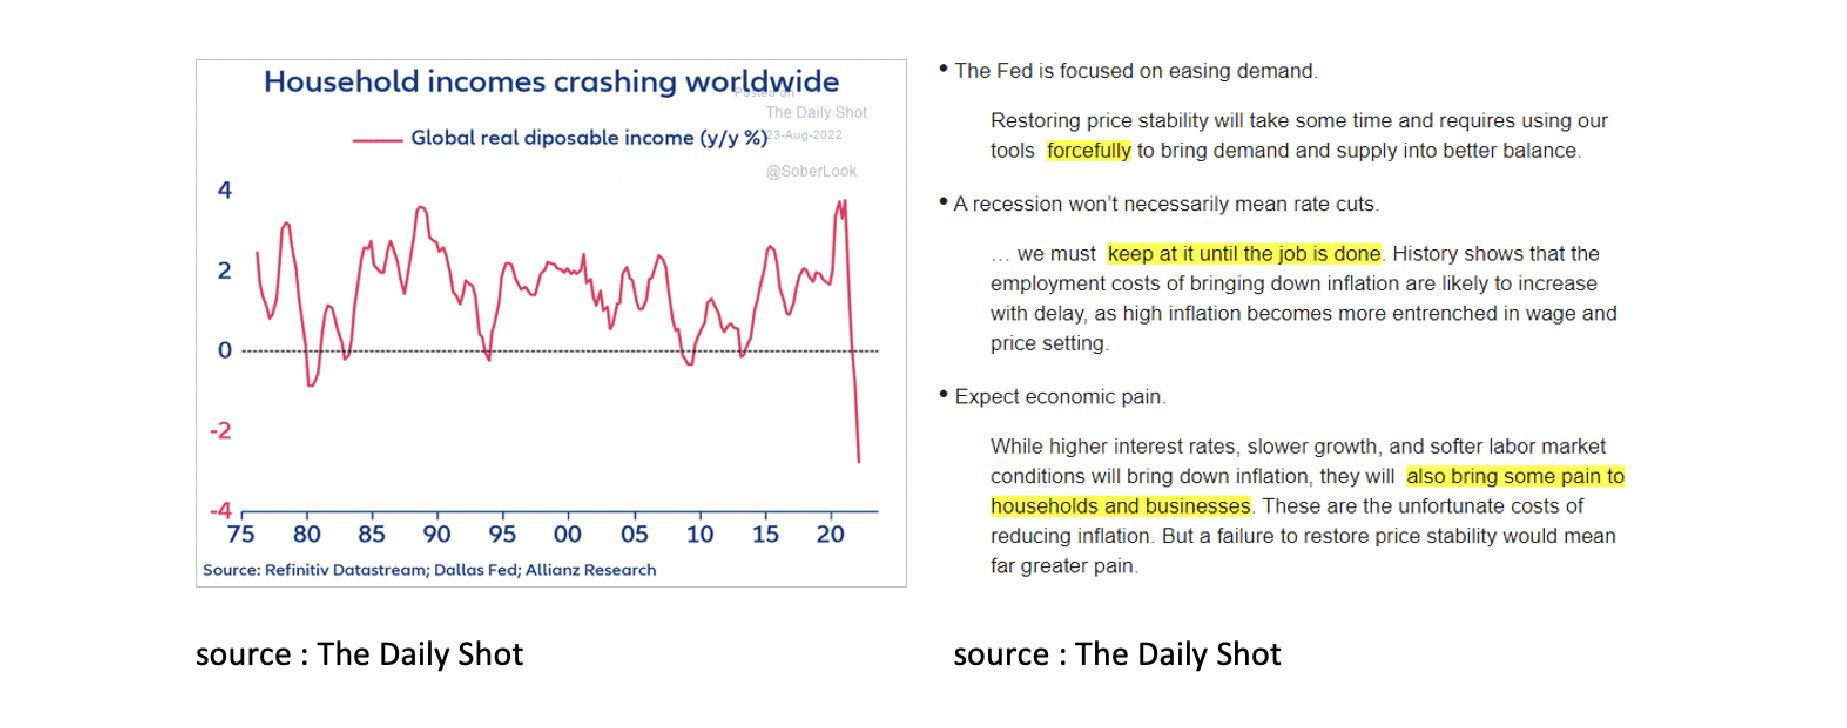
The FED's recent hawkish words are mainly a result of persistently high inflation. Fighting too high inflation therefore remains the number one priority. The FED therefore seems prepared to accept a recession. The ECB also seems to be gradually becoming more and more concerned about persistently high inflation. The general expectation is therefore that both the FED and the ECB will raise interest rates significantly further in September and beyond.
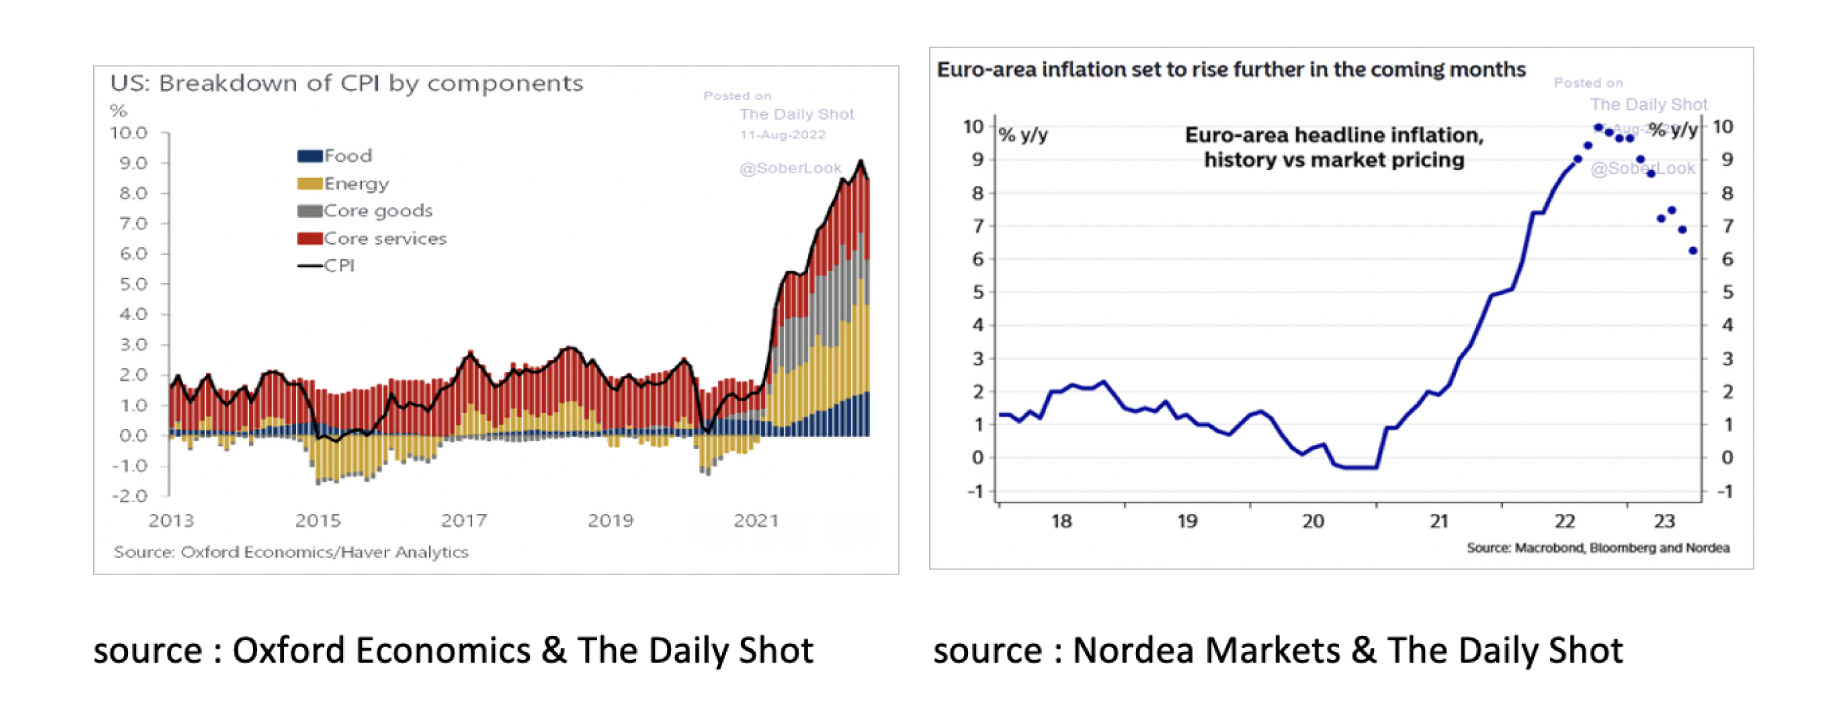
Increasingly, references are made to the early 1980s when then FED Governor Paul Volcker managed to curb the persistent inflation of the 1970s with an extremely tightening monetary policy, raising the FED Fund Rate to 20% in March 1980 and a severe recession in the early 1980s was accepted.
Although the current inflationary environment is often compared to the 1970s and called for a repetition of the solution chosen at the time, it may be useful to look at that other inflationary period after the Second World War: the 1950s.
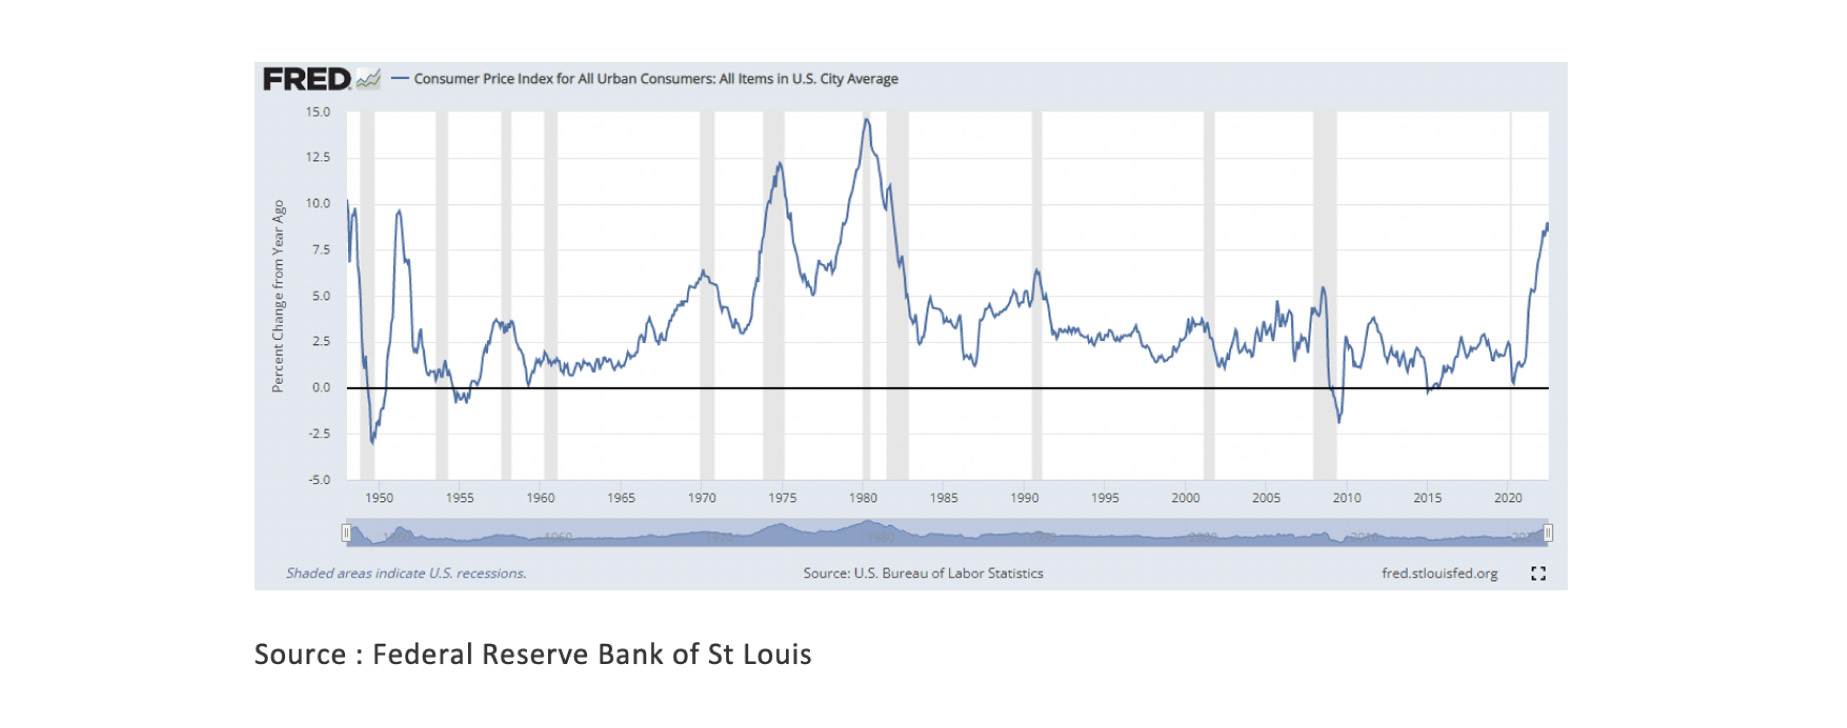
At that time inflation was also more than 10%. The biggest difference with the FED policy in the 1970s was that the FED did not raise interest rates at all to combat inflation. On the contrary, the FED fixed the short-term rate at 0.3875% and the 10-year rate at 2.5%. The question is why did the FED combat inflation in the 1950s in a completely different way than in the 1970s. To explain that it is good to understand that there were some important differences between the 1950s and the 1970s.
After the Second World War, the US Government was confronted with a very high government debt as a result of the “temporarily” extremely high war expenditure. In addition, an important cause of inflation was the misallocation that arose between strongly increasing consumer demand and reconstruction on the one hand, and supply that was still too much focused on a war economy on the other. In order to keep the excessive government debt affordable and to give the supply sector time to adapt from a wartime economy to a peacetime economy, the FED decided to adopt a “temporary” monetary policy that is too loose, despite the 10% inflation.
In the 1970s, on the other hand, high inflation was initially caused by an oil boycott from the Middle East. Because governments fought the recession by adopting a very loose fiscal policy and in many countries, wages were automatically increased with inflation, the so-called price compensation, a wage-price spiral quickly arose that led in the course of the 1970s to ever-increasing inflation. An inflation that the FED finally, after almost 10 years, decided to combat with a “temporary” extremely tightening monetary policy.
The question now is, to which inflation period does the current period most resemble. In our view, the similarities with inflation from the 1950s are by far the greatest. Just like during the Second World War, the government debt has risen sharply as a result of the Covid support packages and, just like then, the FED financed this debt through a very loose monetary policy. Just like then, supply and demand did not match. Back then because the supply of the war economy did not match the new demand driven by consumption and reconstruction, this time because after the Covid Lockdown there was huge catch-up demand on the one hand and logistical problems on the supply side on the other.
Just as in the past, an apparently too low interest rate is part of the FED's policy to keep the current too high government debt affordable. Moreover, an important difference between the energy crisis now and that of the 1970s is that energy prices rose at the time as a result of a boycott on the supply side. This time there is a boycott on the demand side. Europe no longer wants to buy cheap Russian oil and gas. As a result, Europe is forced to buy oil and gas at a premium from other suppliers, while buyers in Asia and Africa can buy Russian oil and gas at a discount. On balance, Russia's oil and gas supplies to the world have hardly decreased, if at all.
Moreover, a major difference between the excessive inflation now and that of the 1970s is how long this high inflation has last. The chart below clearly shows that inflation in the 1970s was of a completely different order from the current inflation that resulted from the release of the Covid Lockdowns and Russia invading Ukraine. In addition, for a number of years now, the FED has no longer set an inflation target of a maximum of 2%, but of an average of 2%. The current over-inflation has “only” taken the inflation trend to slightly above the FED target of 2% on average.
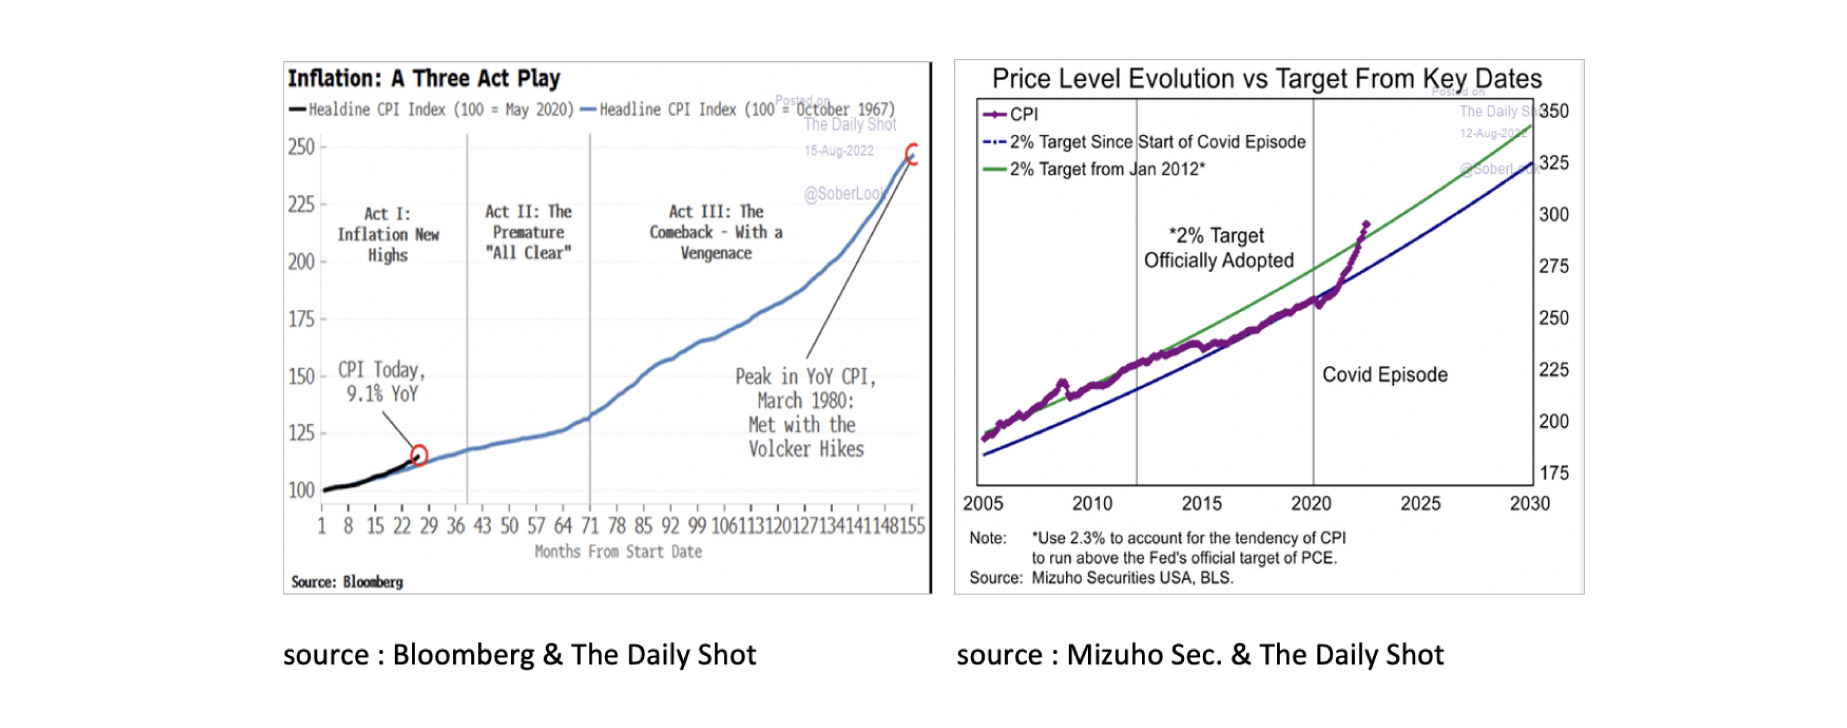
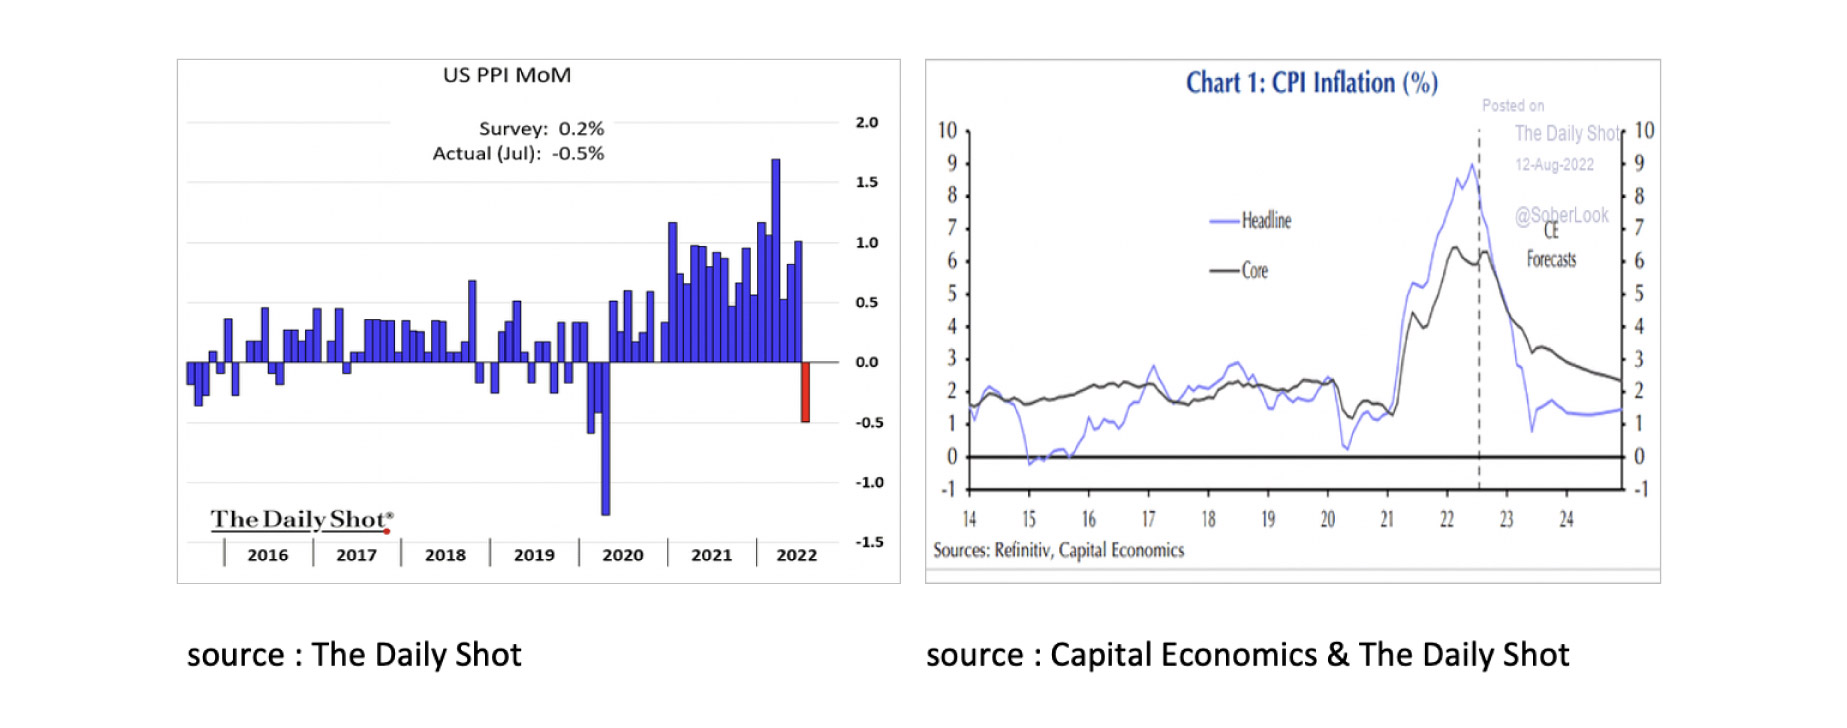
In our opinion, the FED will therefore remain cautious for the time being with regard to raising interest rates too aggressively, reducing the bonds on the FED balance sheet (QT) and causing too deep a recession and financial crisis. We therefore continue to believe that, as in the past period, the FED (and the ECB) will bark a lot in order not to shame its image as an inflation fighter, but in practice will bite less, i.e., raise interest rates, than many market participants expect. We expect that the FED will soon be supported by the fact that inflation in the US looks set to fall rapidly in the coming months. In July, the Producer Price Index fell for the first time in over 2 years. Thanks in part to the recently sharp drop in oil prices. Capital Economics concludes that headline inflation in the US will come down quickly and sharply in the next 12 months.
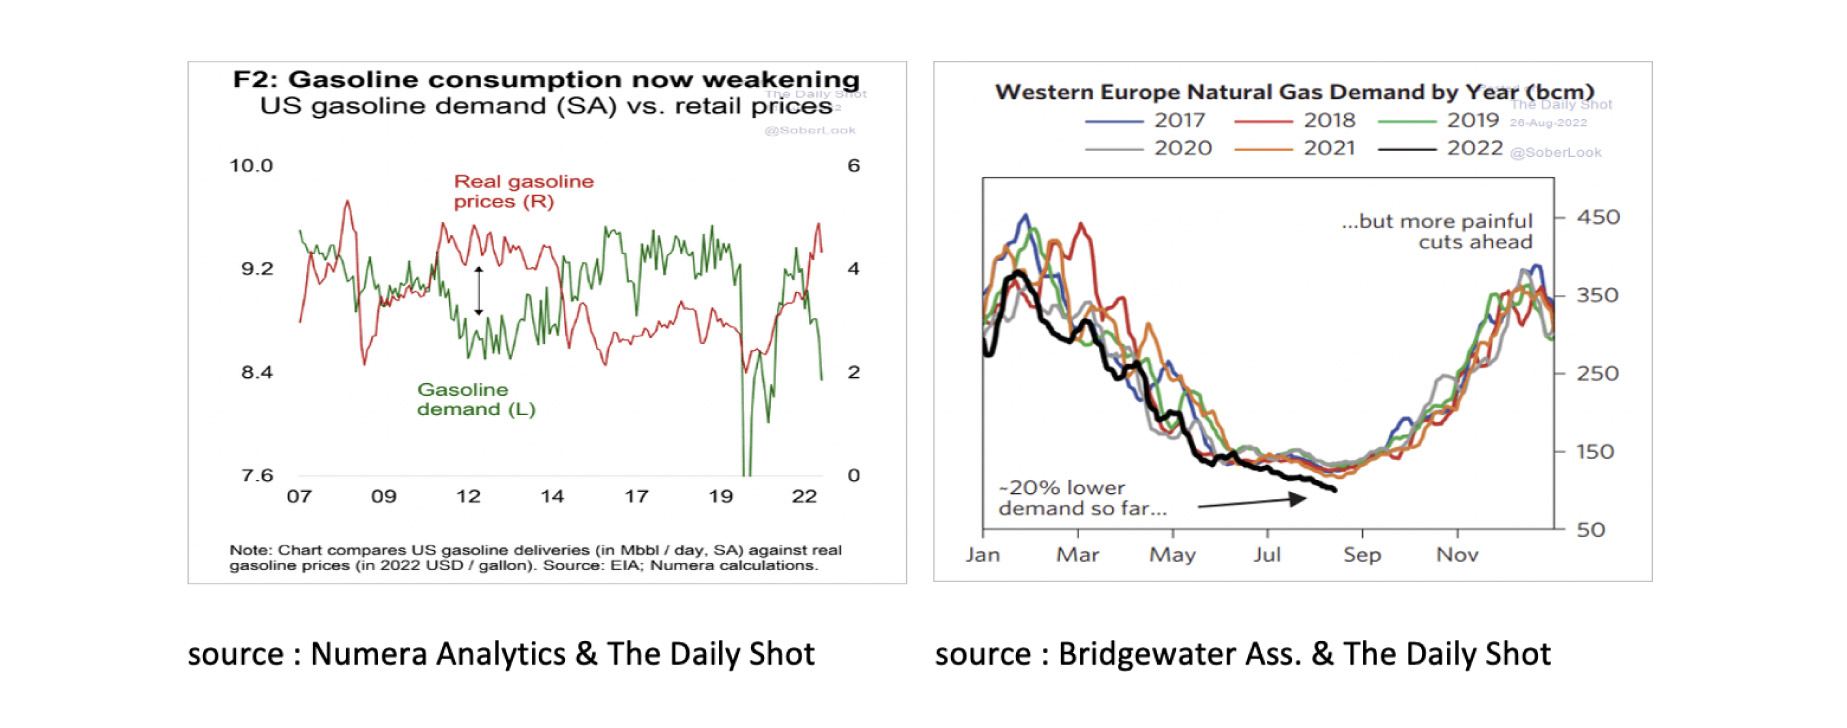
In that regard, it is positive that the demand for energy in the US and Western Europe has recently dropped significantly and the gas inventories in Europe are now 80% full.
If our expectation of a sharp decline in inflation materializes soon, the FED may have finished raising short-term interest rates by the end of this year and, in our view, a relatively mild recession could remain.
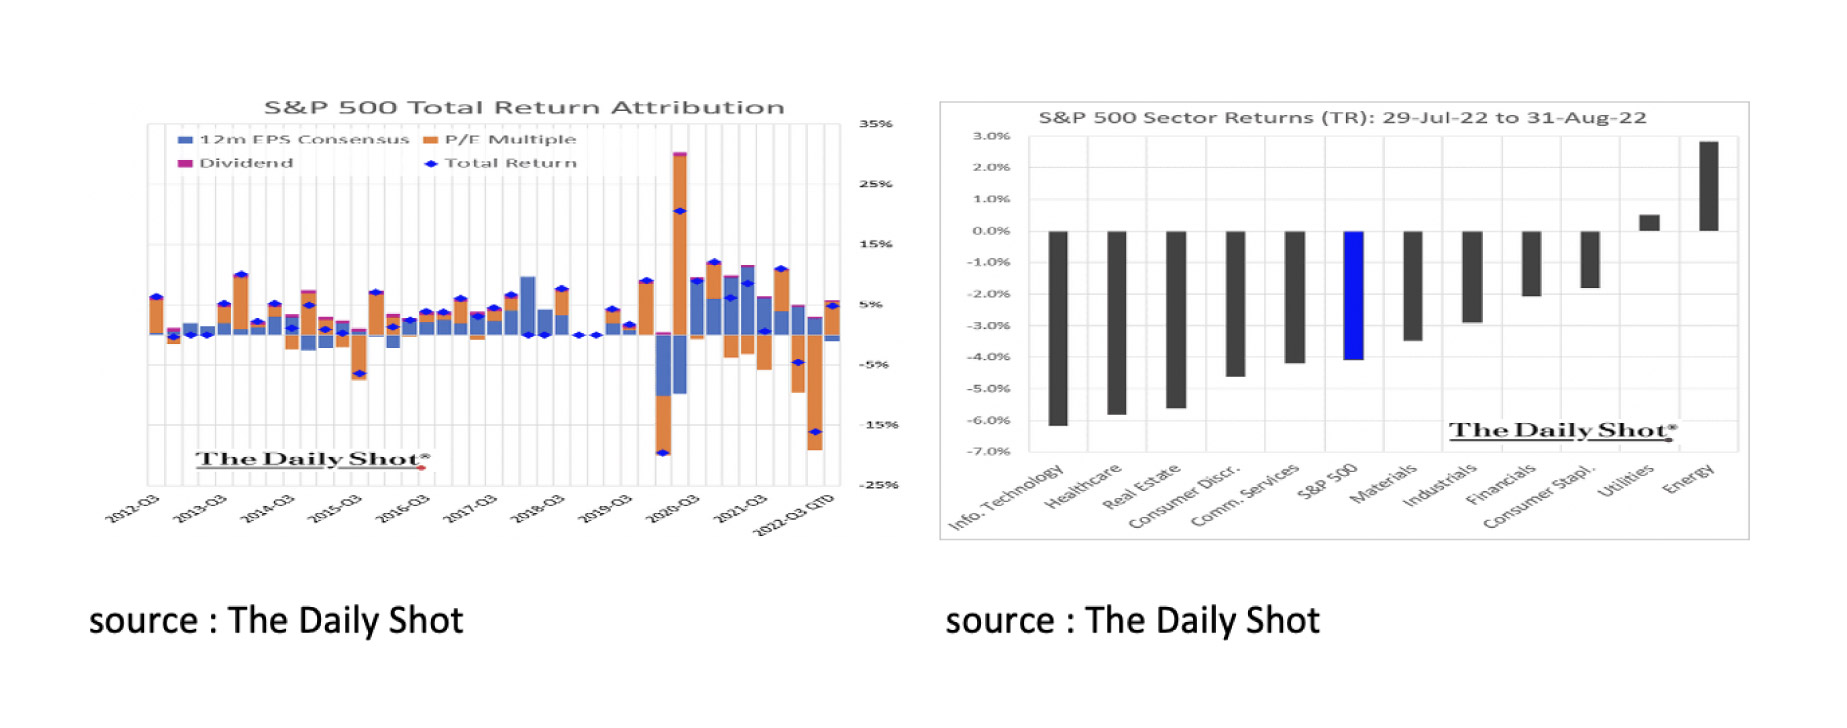
Looking at the chart below on the left, we see that 2022Q3 has been a good quarter for equities so far. The S&P 500 is up 5% (in USD) since June 30. However, this is not the feeling that shareholders ended the month of August with. The 22Q3 gain was accompanied by a decline in corporate profits and was entirely driven by the +9% (in USD) in the month of July. The return on the S&P 500 in August was a disappointing -4% (in USD). In addition, returns in all sectors except Utilities and Energy were negative.
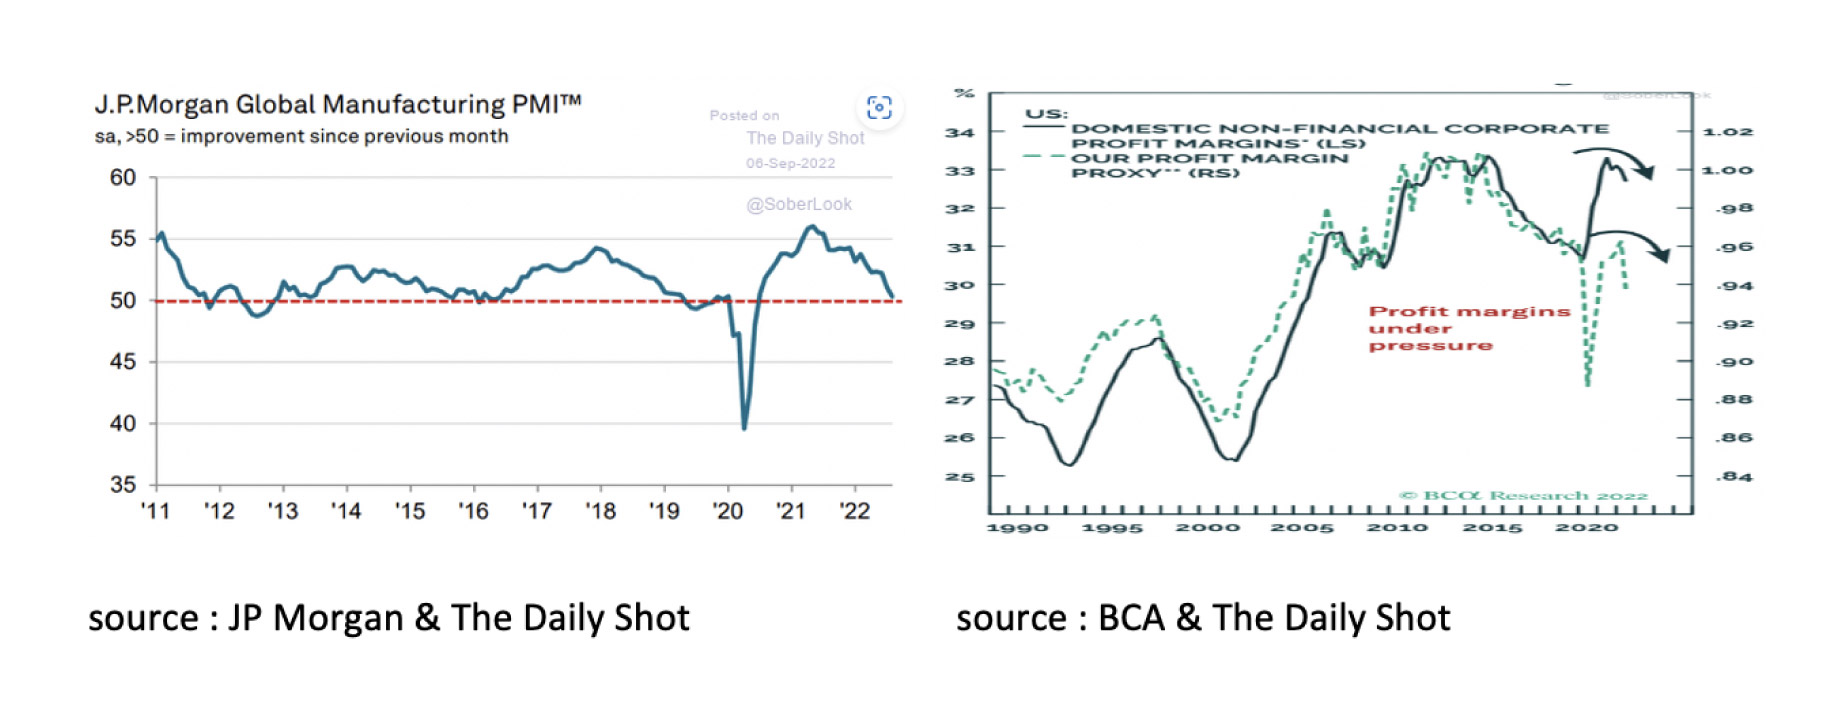
The outlook for equities will remain shrouded in uncertainty for the time being. The chance of a global recession is increasing by the day, corporate profit margins are coming under increasing pressure and the FED will raise interest rates again (significantly) in September.
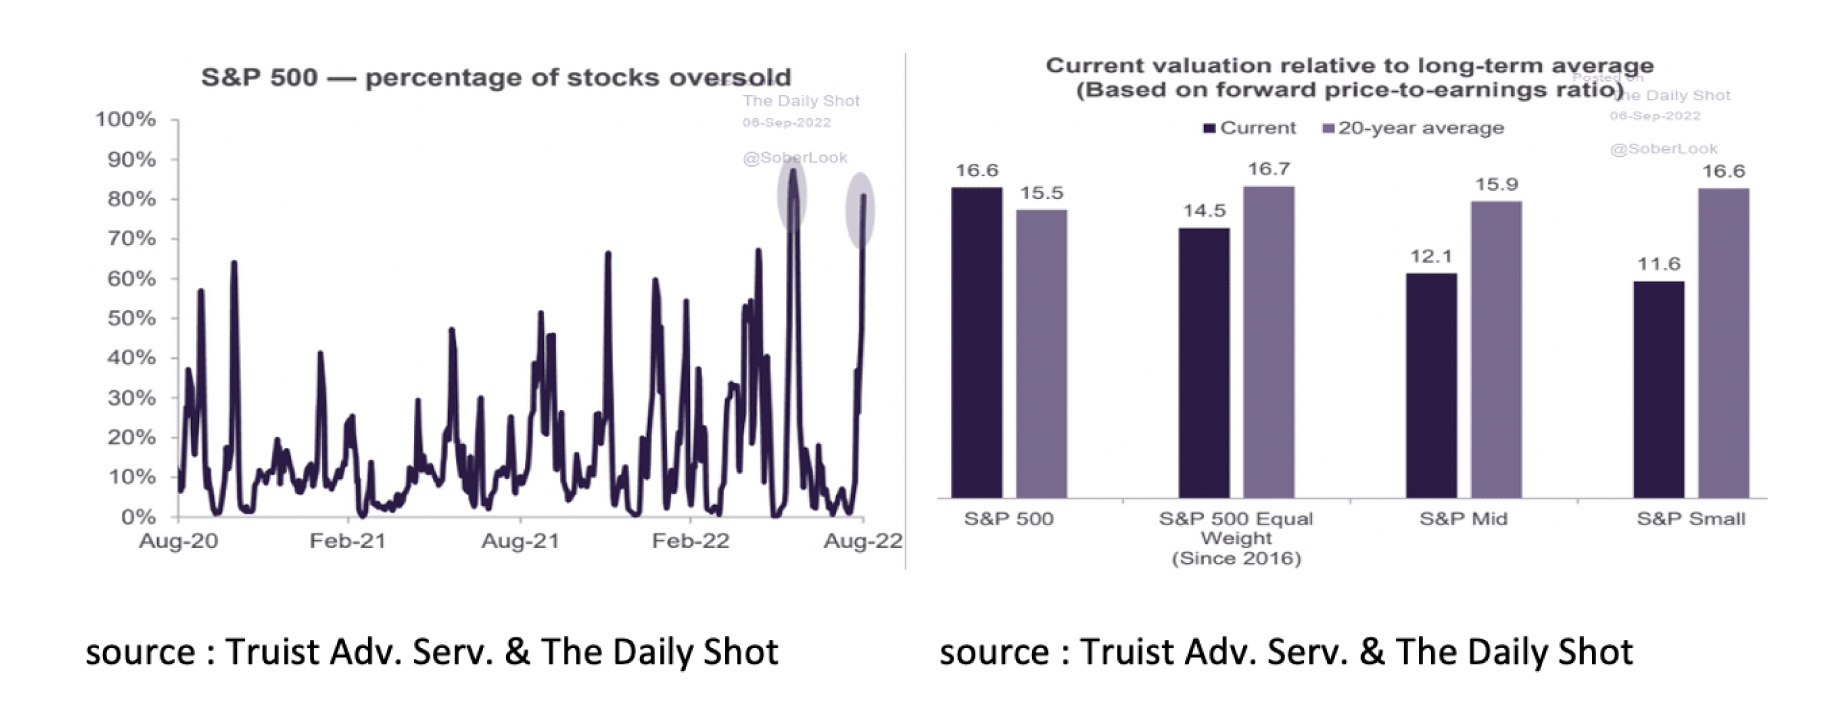
However, despite all the uncertainties, we are not in favor of turning our backs on the stock market. A very large proportion of stocks in the S&P 500 are currently oversold. In addition, many stocks currently have a significantly lower valuation than the historical average. Many possible setbacks seem to have already been discounted.
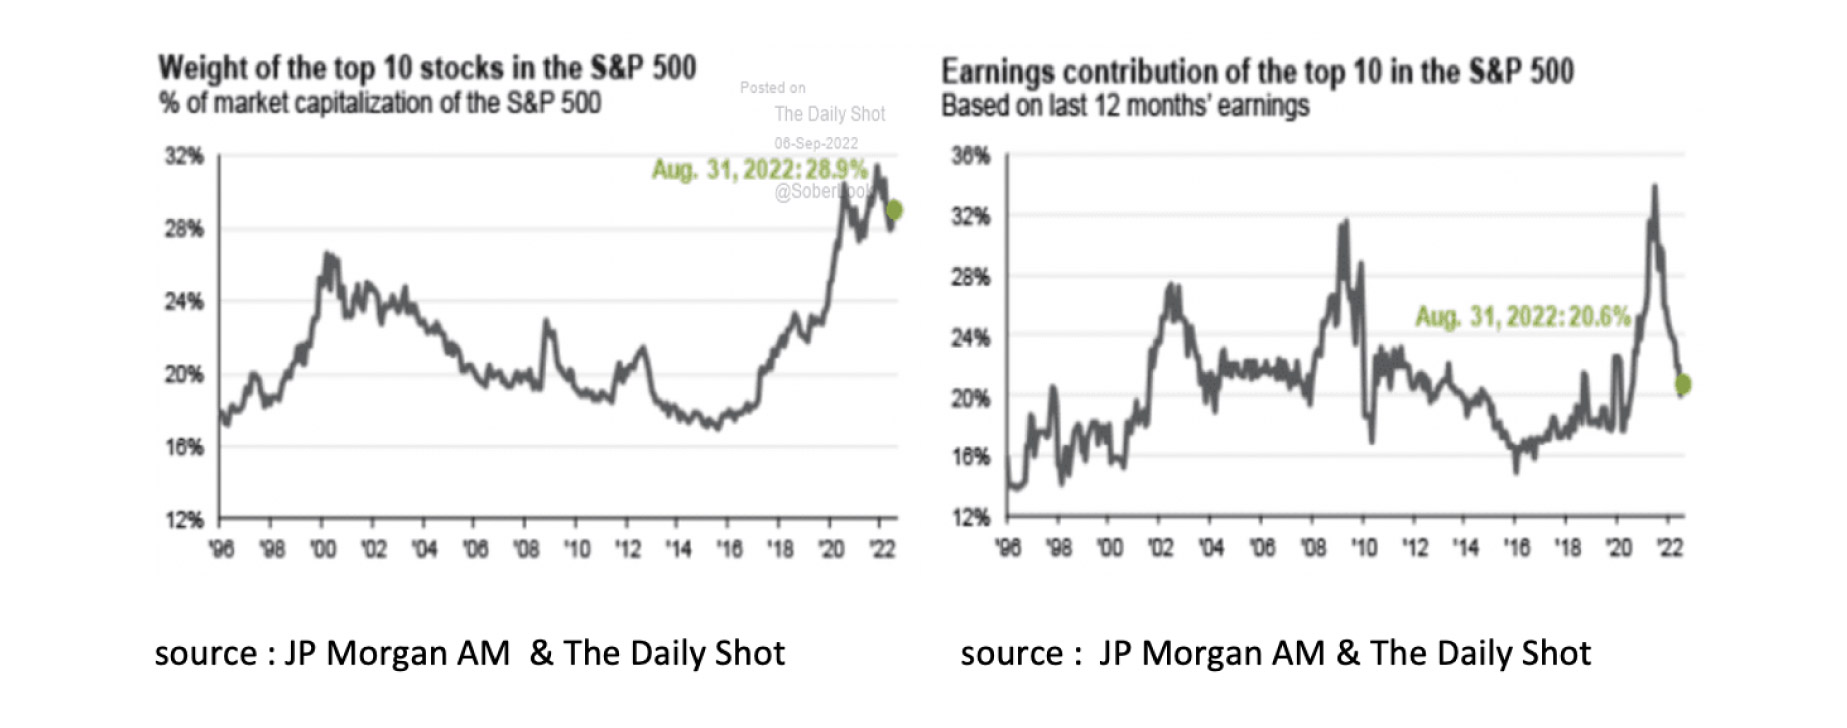
Furthermore, the fact that the S&P 500 itself is relatively expensive is mainly due to the top 10 companies in the S&P 500. These 10 companies make up a historically high percentage of the S&P 500 at 28.9%. This is all the more remarkable considering that these 10 companies currently only account for 20.6% of corporate profits.
There are also equities that, although not without risk, have historically lagged strongly, such as Emerging Market equities. Only during the Asia crisis in 1998 did Emerging Market equities lag so much behind the S&P 500 as they do now.
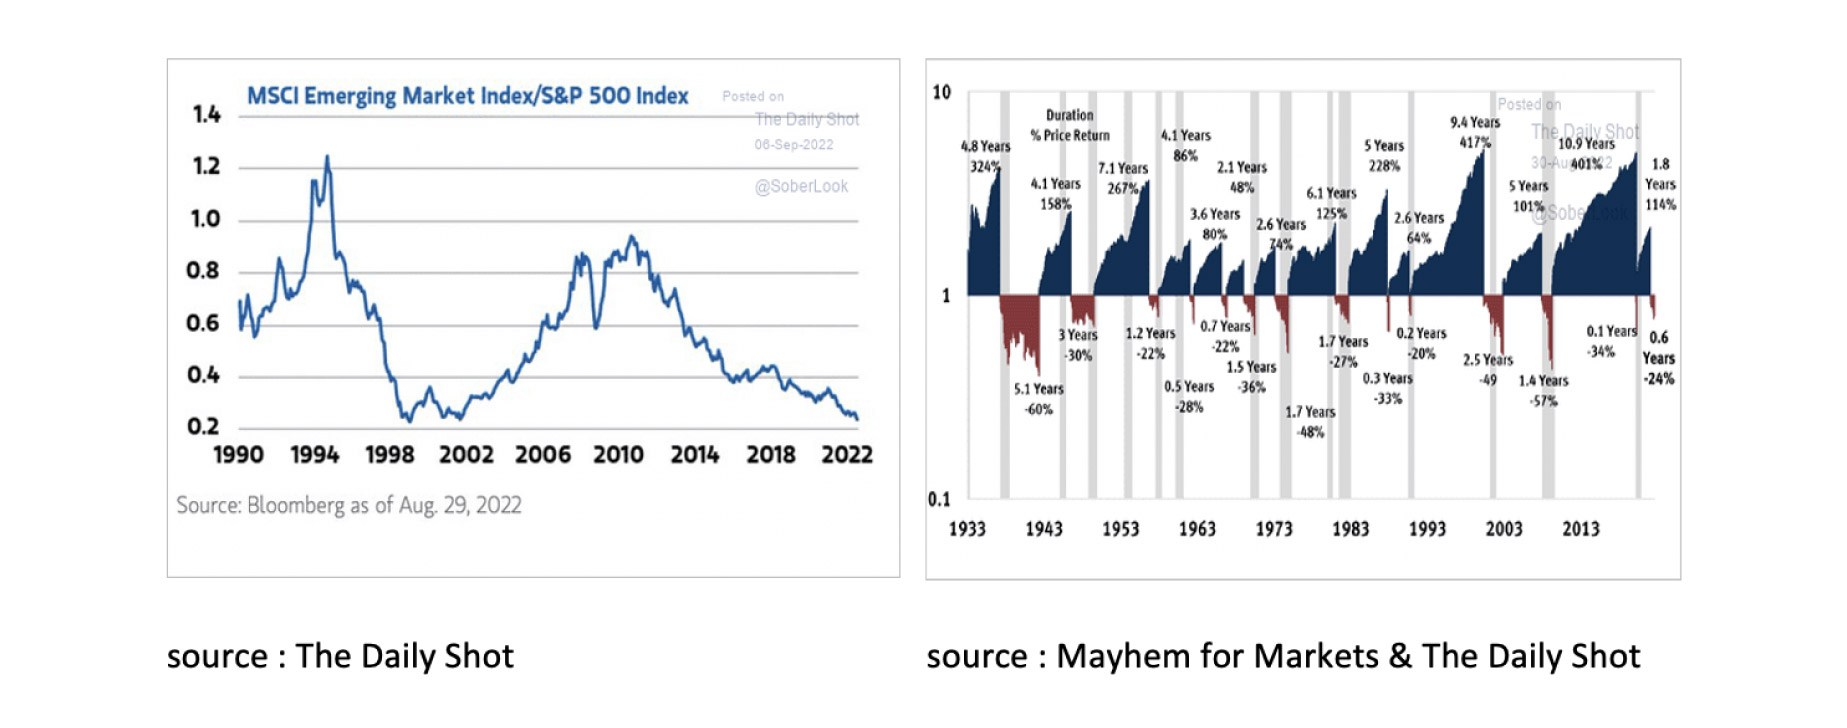
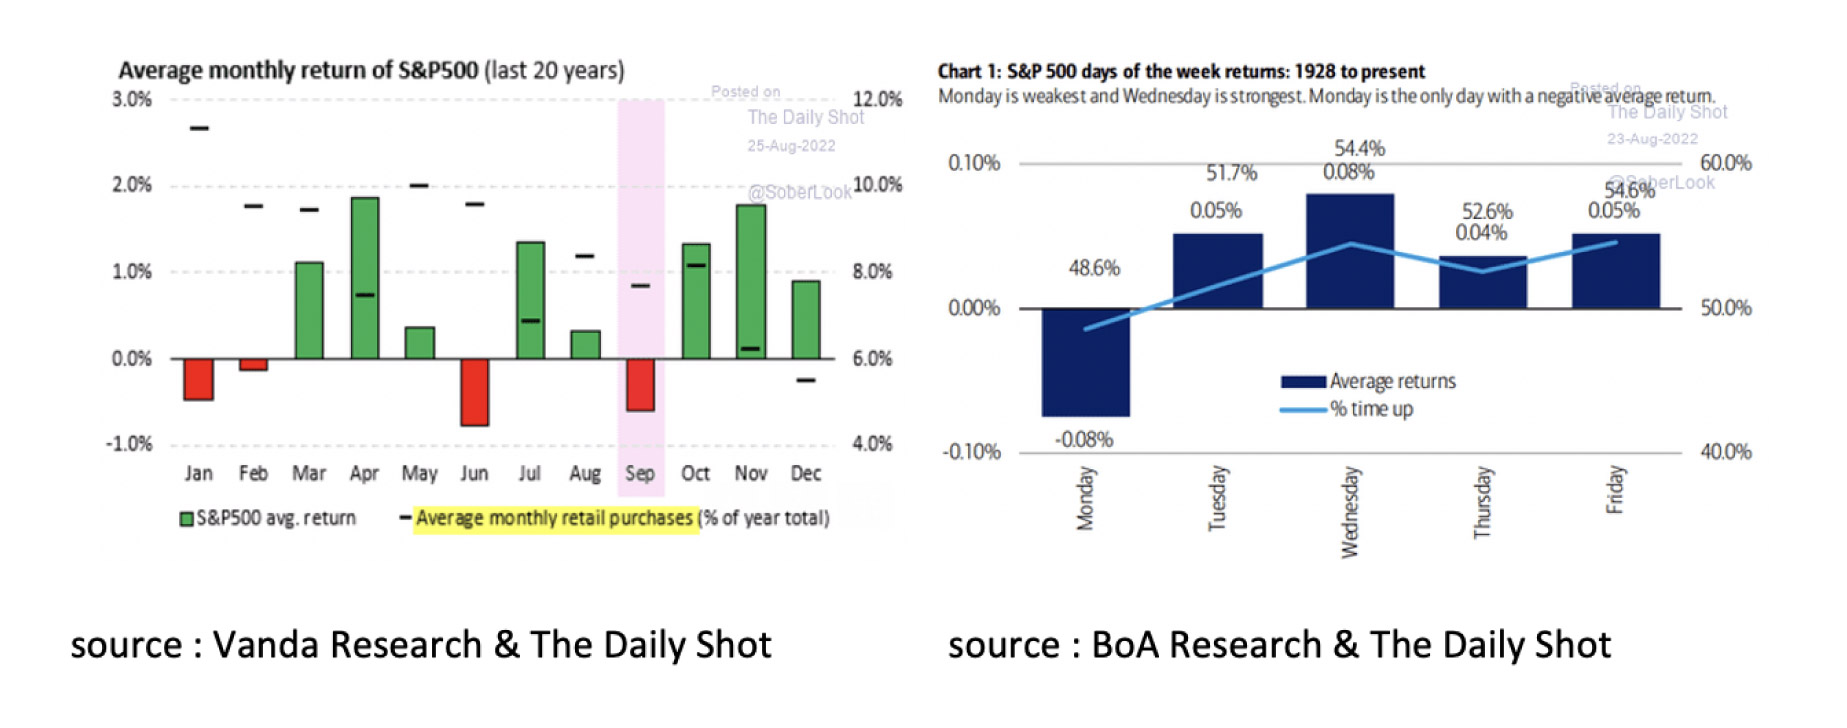
Another reason why we are not in favor of selling as a long-term investor in equities is that between the Suez crisis in 1956 and the Covid crisis in 2020 there have been 14 bear markets with an average correction of -29%. Five years after the bear market, equities were on average 110% higher. So, it pays to be a long-term investor and not to panic. Finally, two more charts for investors considering increasing their stake in equities. January, February, June and September are historically not the best months for equities, while the same holds true since 1928 for Monday.
August was also a bad month for bonds. Capital market rates rose almost everywhere in the world. In the US, Leveraged Loans were the only category to deliver positive returns.
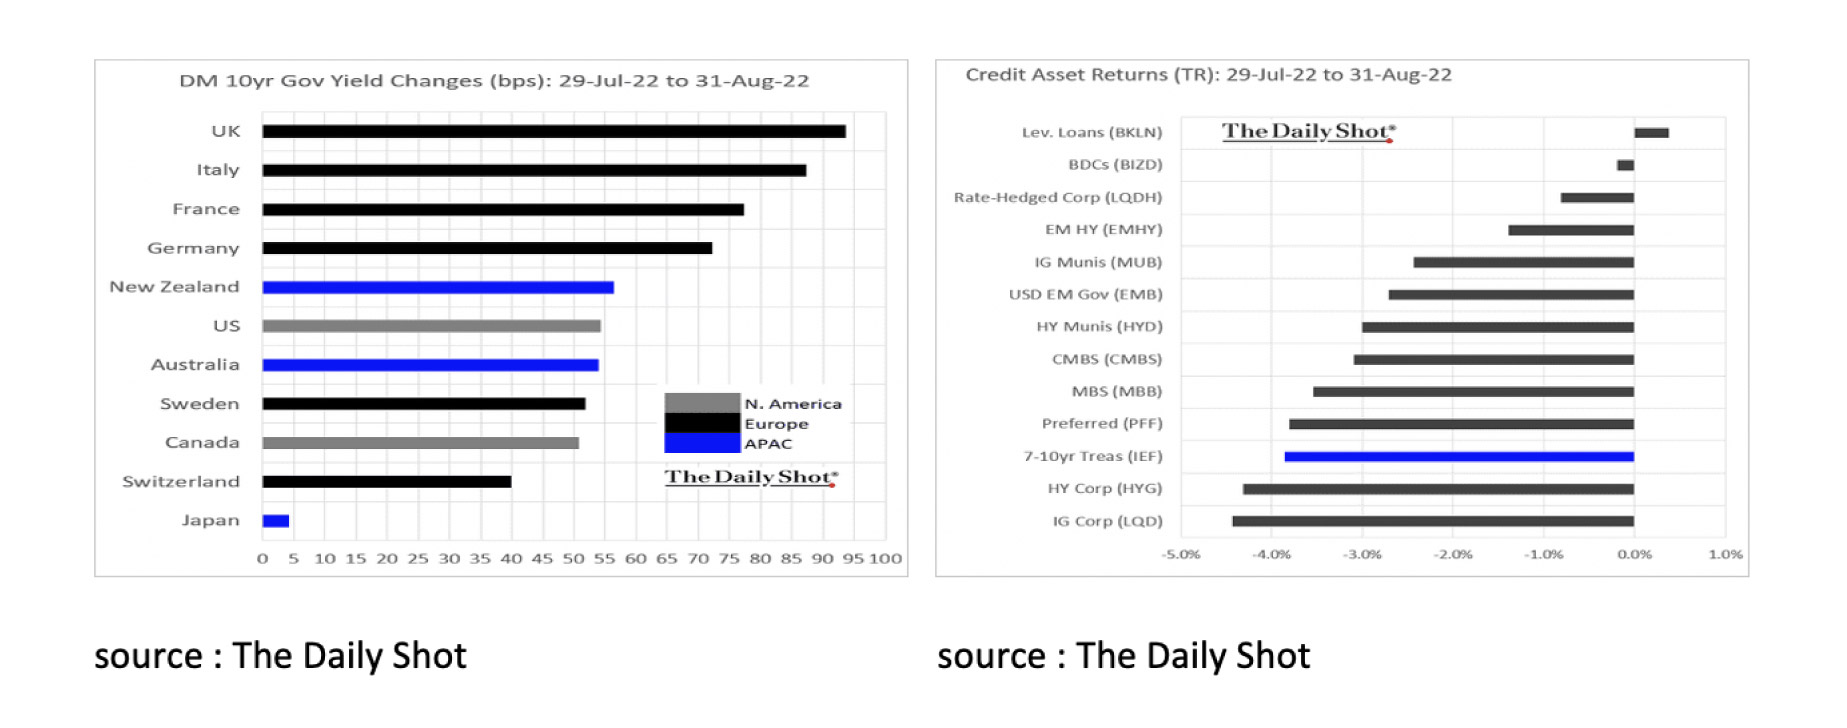
On balance, capital market yields rose not so much because investors became more negative about the inflation outlook, but mainly because they demanded a higher risk premium in anticipation of the FED's balance sheet reduction, or Quantitative Tightening (QT).
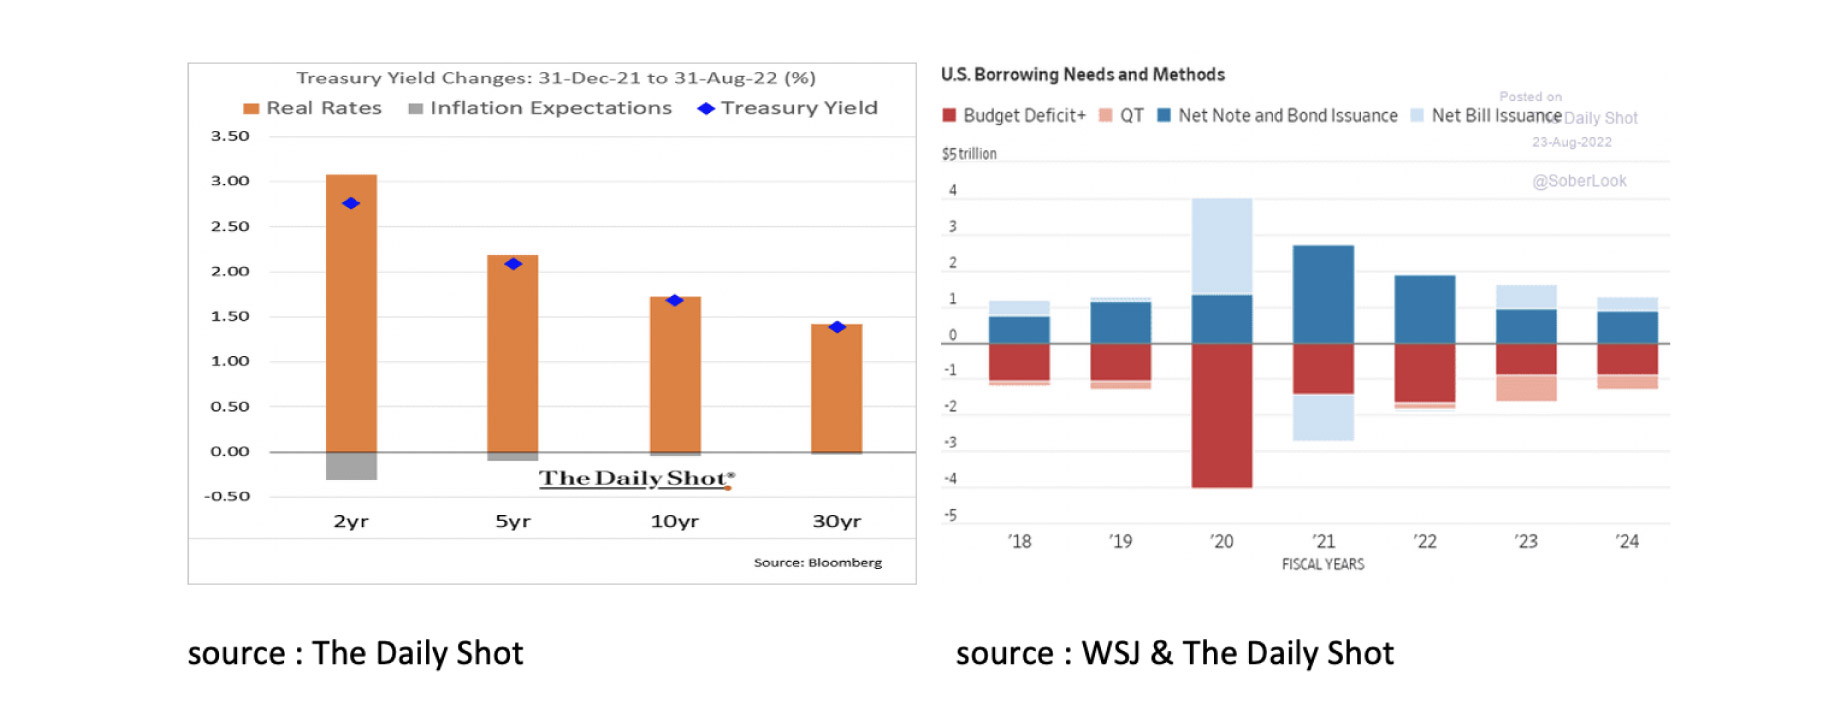
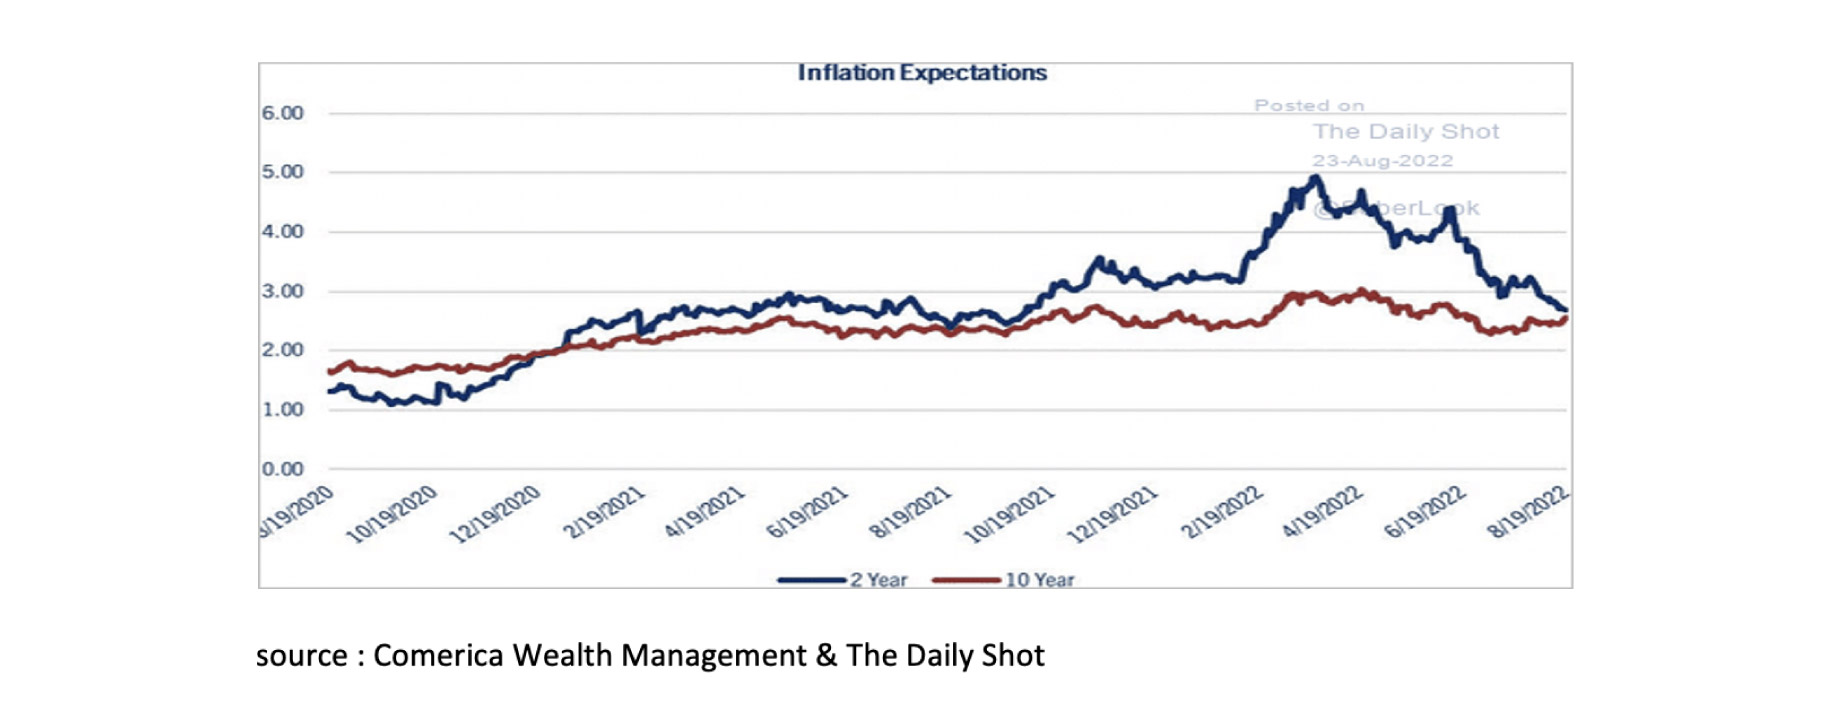
However, the FED's QT is expected to coincide with a significantly smaller US government deficit and thus a significantly lower capital requirement, which may limit QT's impact on the capital market. Another positive for US bonds is that inflation expectations for the next 10 years remain below 3%, while expectations for inflation in the next 2 years have recently fallen sharply to 3% as well. At 3.25%, the 10-year UST thus offers a positive real interest rate.
August was disappointing for investors in Commodities. While there were certainly a number of categories that rose in price, there were also many commodities that fell in price, including Brent Crude and US Gasoline. We remain of the opinion that, with a global recession imminent and gas supplies in Europe almost up to scratch, commodities are not interesting for the time being.
Finally, some charts and notes on the USD. The outlook for the USD remains positive for the time being. The UK and the countries in the Eurozone are significantly more affected by the sanctions against Russia than the US. Moreover, while inflation in the US seems to have peaked in the meantime, this is not yet the case in Europe. This is partly due to the fact that the US is better able than Europe to meet its own energy needs. In addition, the USD is supported by the higher capital market interest rates in the US and the more aggressive interest rate policy of the FED than of the ECB. The fact is, however, that by many measures, such as the Purchasing Power Parity, for example, the USD is currently strongly overvalued against almost all currencies in the world.
Disclaimer:
While the information contained in the document has been formulated with all due care, it is provided by Trustmoore for information purposes only and does not constitute an offer, invitation or inducement to contract. The information herein does not constitute legal, tax, regulatory, accounting or other professional advice and therefore we would encourage you to seek appropriate professional advice before considering a transaction as described in this document.
No liability is accepted whatsoever for any direct or consequential loss arising from the use of this document.


